Visualize learners' "weak points," analyze their progress.
Let's enhance effective e-learning.
Visualize learners' "weak points," analyze their progress.
Let's enhance effective e-learning.
Quiz and scoring functions in our e-learning system, learningBOX, enables you to extract score distribution and section analysis from members' answer data to each grade.
This article will tell you "members' answer analysis" by "tags" and gradebook on learningBOX.
Admins can check at a glance the members' level of understanding, how they overcome their weak points, the scores for each subject and overall trends.
If you are looking for some tips to survey members' trends and score distribution, this article will help you.
We are happy if you try the quiz function and gradebook of learningBOX.
Content
- Easy creation of web-based exam
- Visual analysis by answer data
- Radar chart analysis for score management
- Summary
Easy creation of web-based exam
The quiz feature of learningBOX makes it easy for anyone to create an exam.
Even if you are not confident in your computer operation or IT skills. Quiz creation form allows you to create a test just in a few minutes.
You can create exams with a combination of 13 different question types, including MCQ, True/false and fill-in-the-blank.
In addition to those types, Prerequisites are available to set. With this function, you can limit the number of members who can proceed to the next contents. For instance, only those who have viewed a displayed content are allowed to go on to the next one.
Set a tag to each quiz
One of the quiz functions, Tag function, enables you to set tags for quizzes you create.
When you attempt quizzes with tags, the number of correct answers, wrong answers, and percentage of correct answers for each tag can be scored/analyzed in the Progress record.
Depending on your purpose and application, quizzes can be categorized more specifically. Therefore, it is a great use to utilize this feature in order to find out members' weak areas and for self-analysis.
Tags can be set for each section of quiz/test, or for quizzes in the same category.
How to add a tag
You can add a tag while creating a quiz in Manage contents.
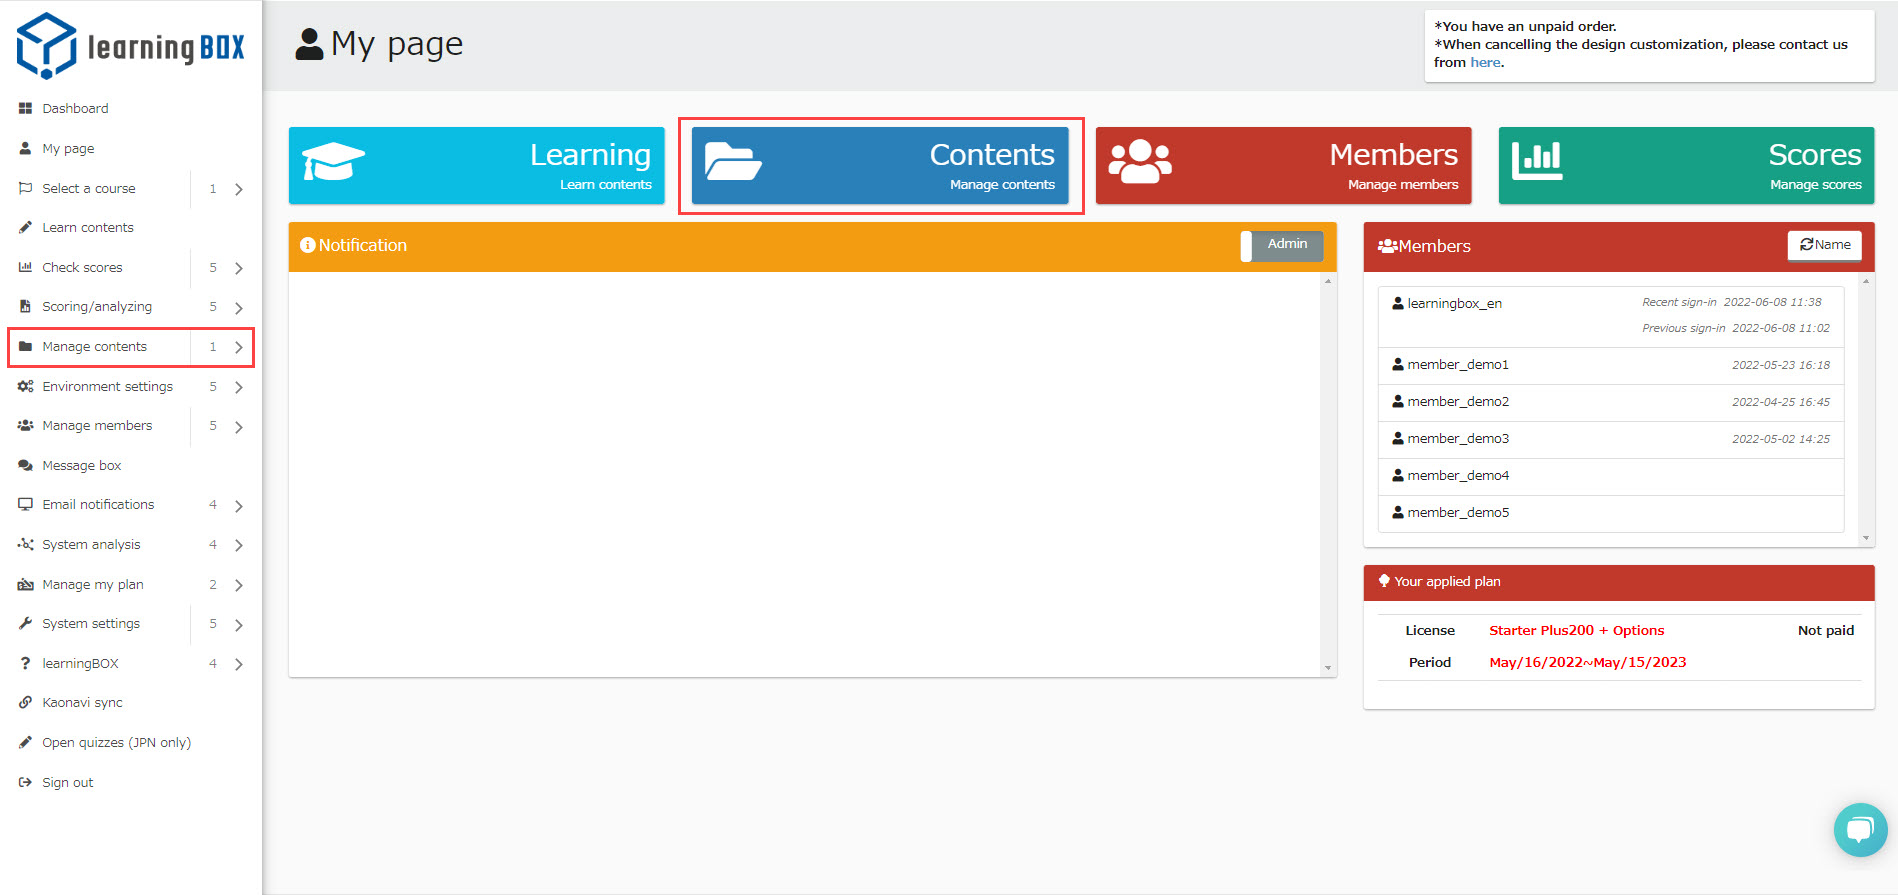
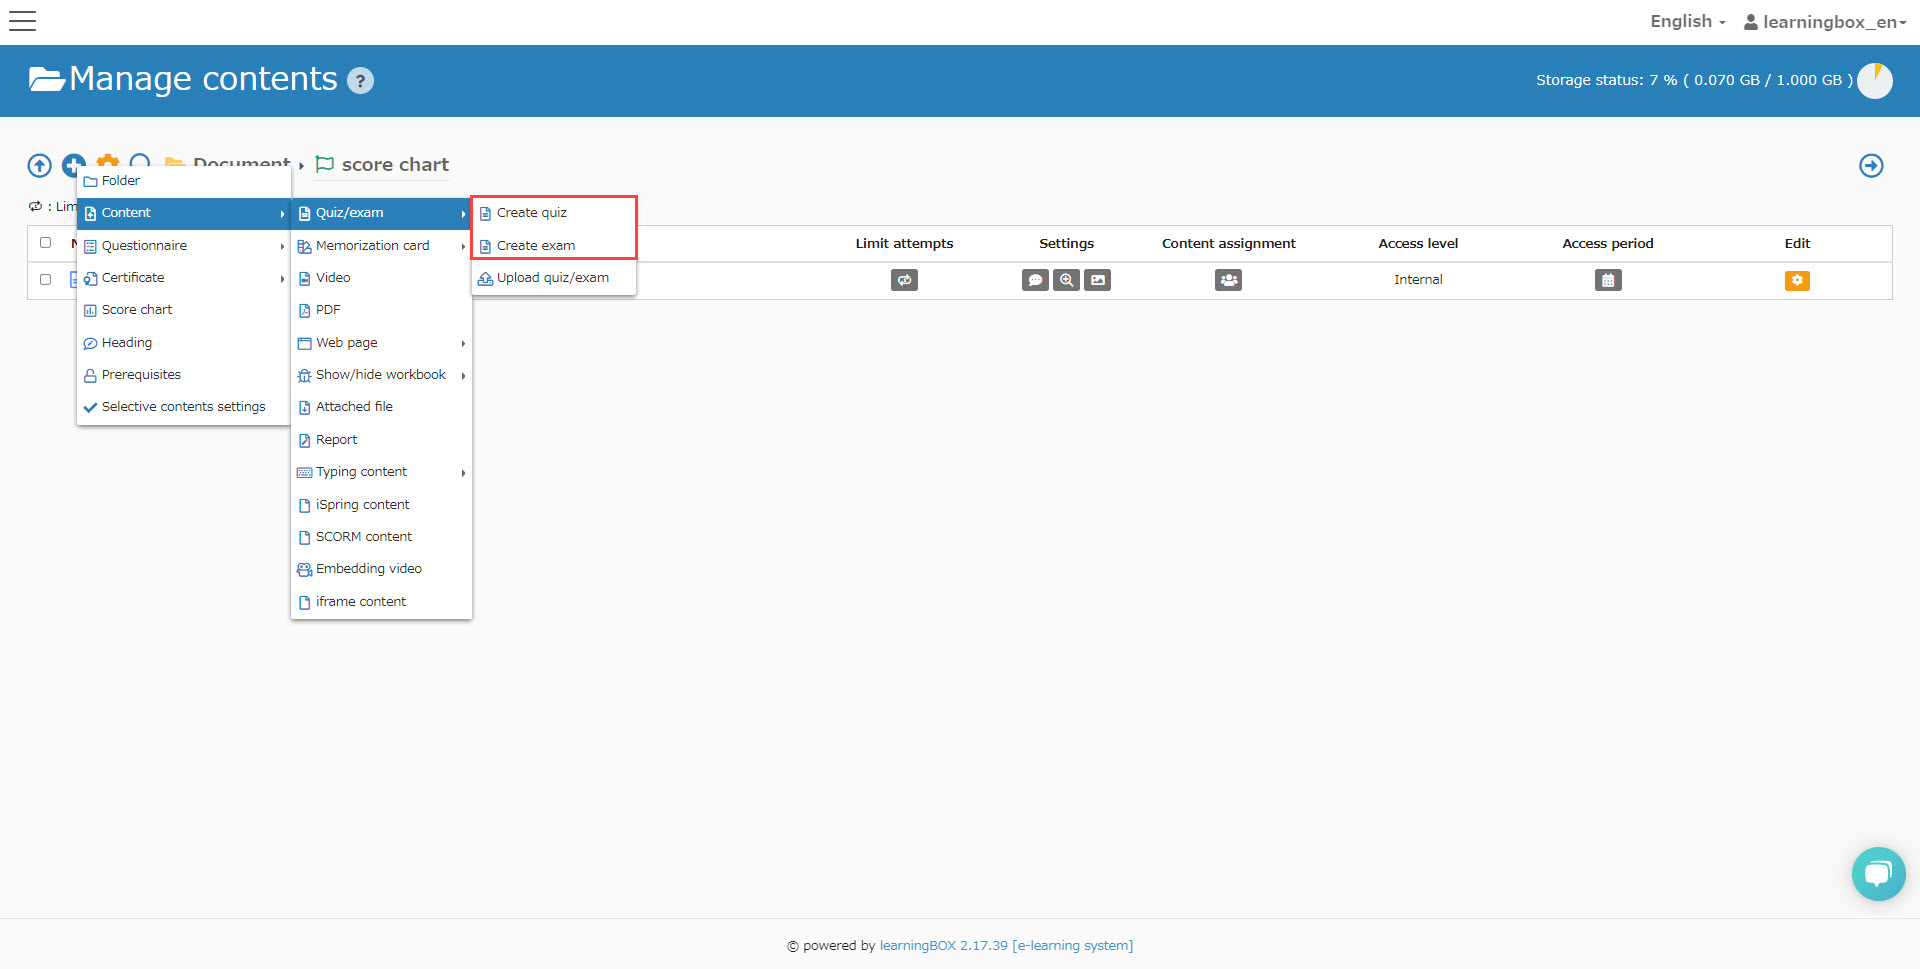
Step 1: Open "Manage contents"
Click on "Manage contents" in the side menu.
Step 2: Create a quiz/exam
This time, the Quiz/exam creation form is used as an example.
Click on the "+" button > "Content" > "Quiz/exam" > "Create quiz" or "Create exam."
※Create a course on the top screen of "Manage content" first, and create a quiz/test within the course.
Step 3: Add a tag
Click on the "Edit tag."
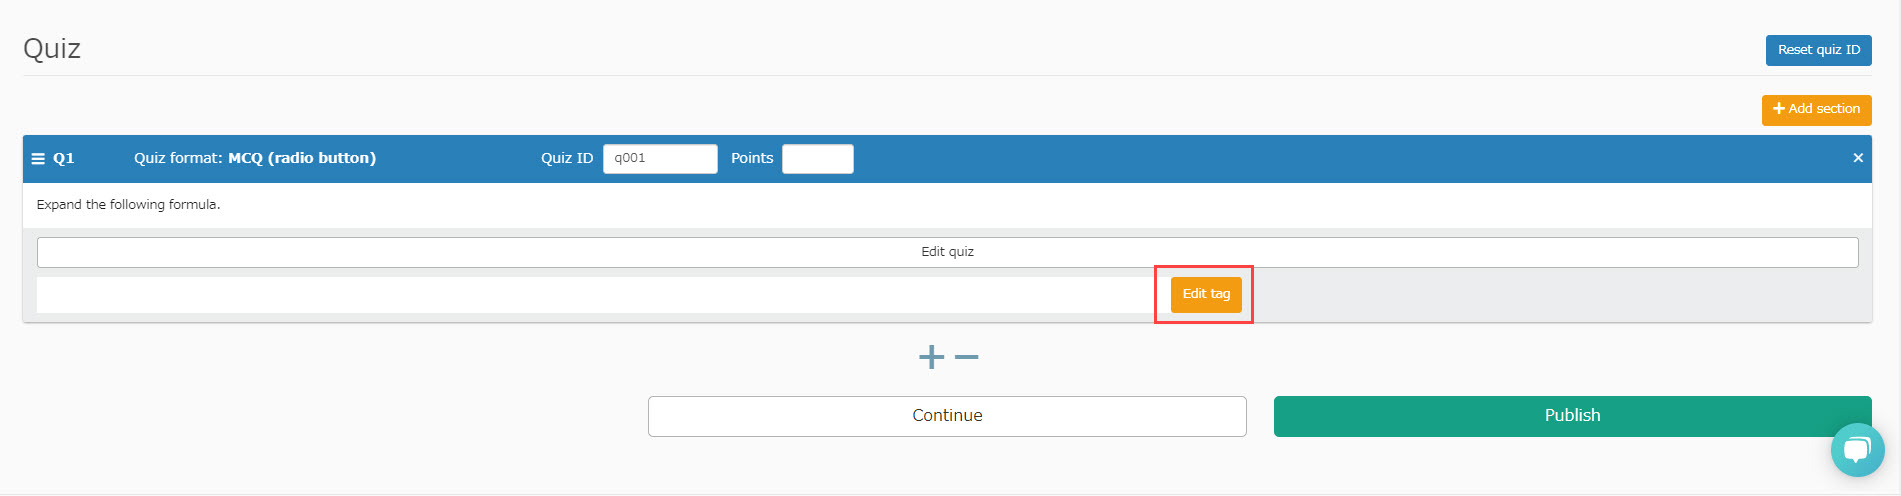
For section tags, click on "+Add section" > "Edit tag."
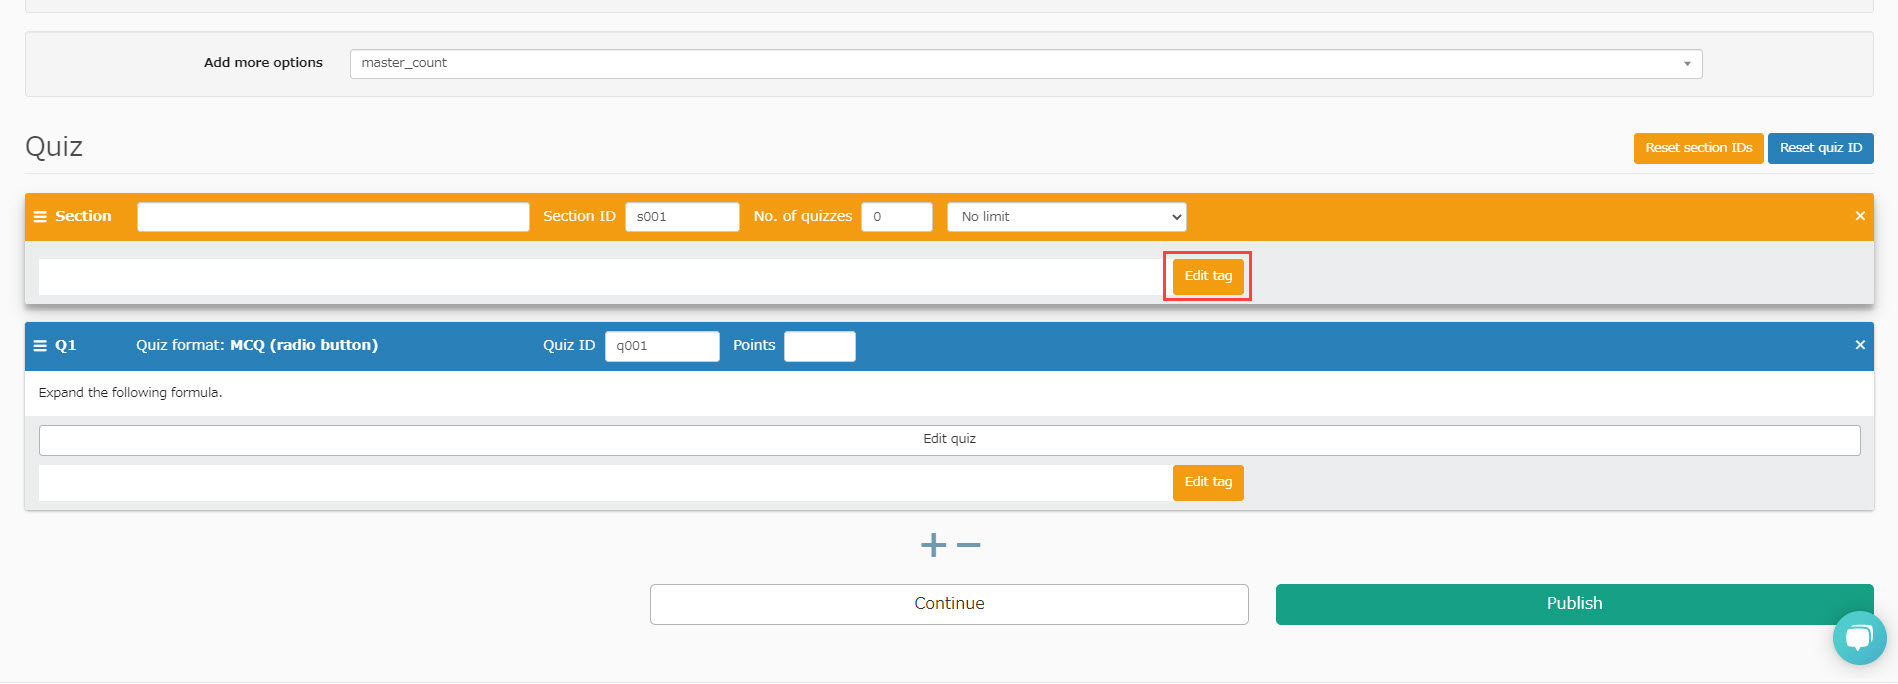
※To add a section tag, "Mode" should be "Normal Mode" in the "Options."
For more information, click on Tag function.
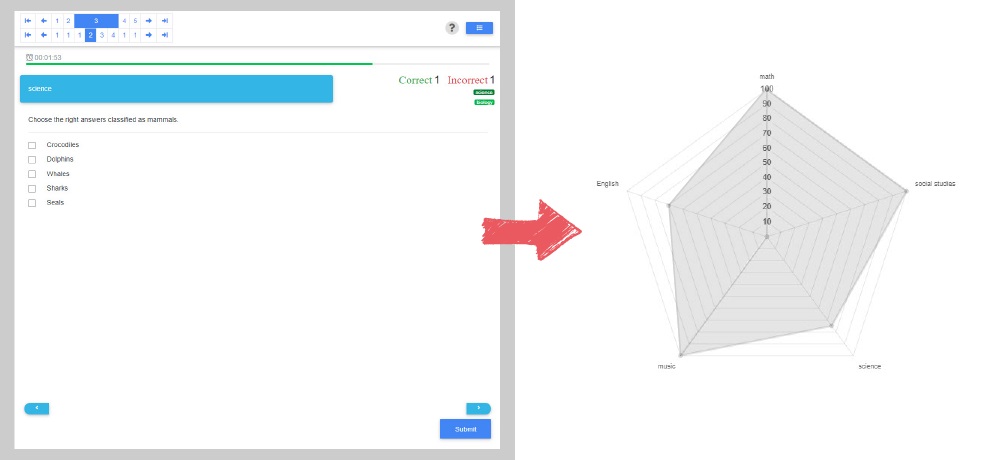
Visual analysis by answer data
Learners' grades can be checked through the "grade management" and "medical record functions".
"Manage scores" is for "overall" score management while the Progress record is for "each member" to manage and analyze score data.
Make effective use of tags and Progress record
When you attempt a quiz/exam for which you have set a tag, your score data for each tag will be displayed on the Progress record.
Progress record visualizes how long each member learns every day, which quiz they are good at or bad at, etc., based on graphs and score data.
Batch download of score data in CSV is also available.
Display of Progress record
Here is the direction to check the details of the Progress record.
Step 1: Click on "Progress record"
Click on "Scoring/analyzing" > "Progress record."
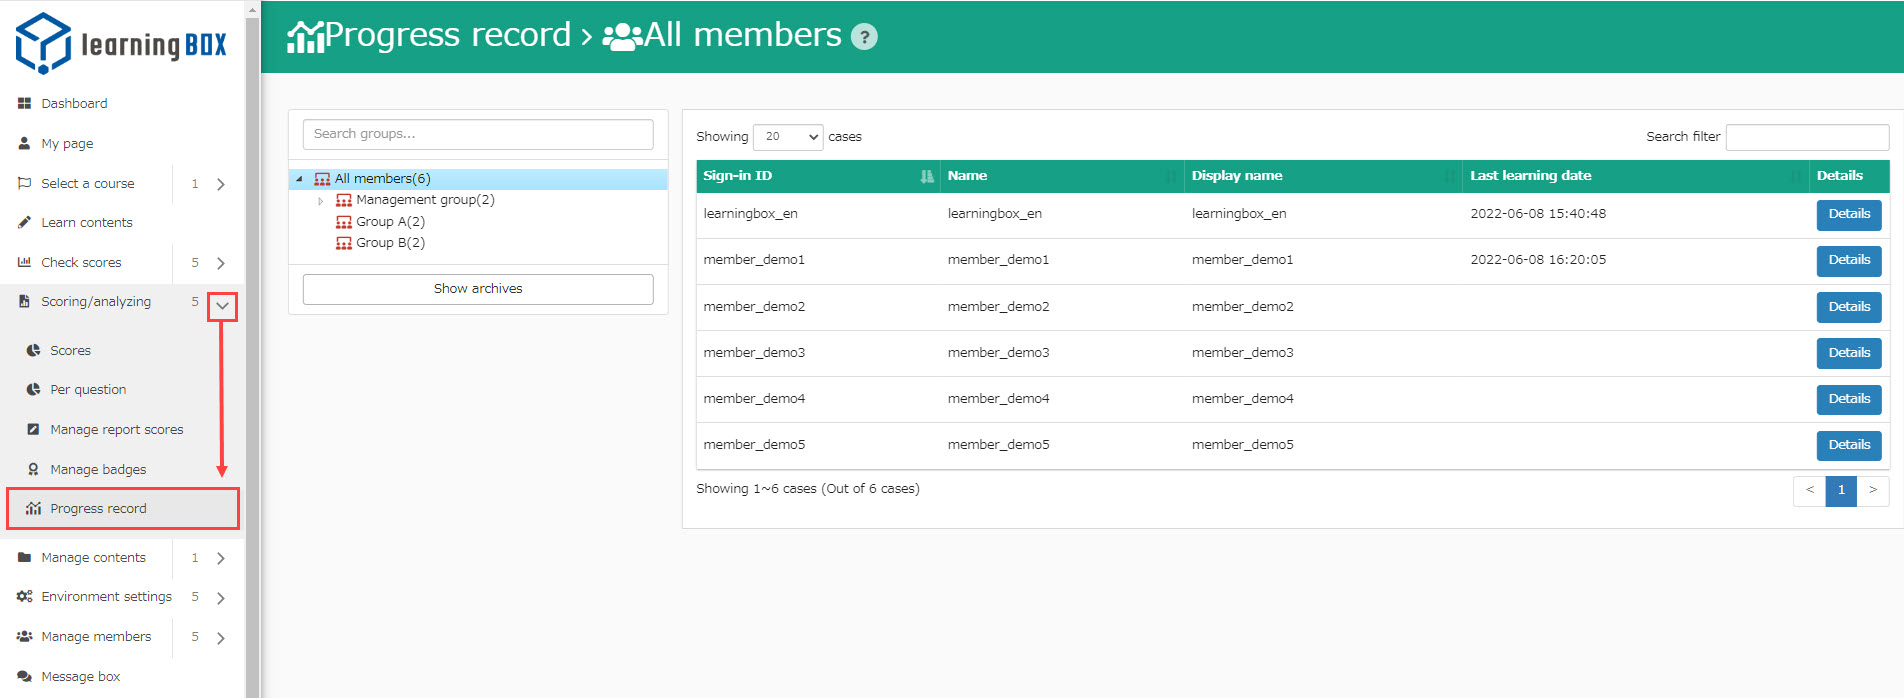
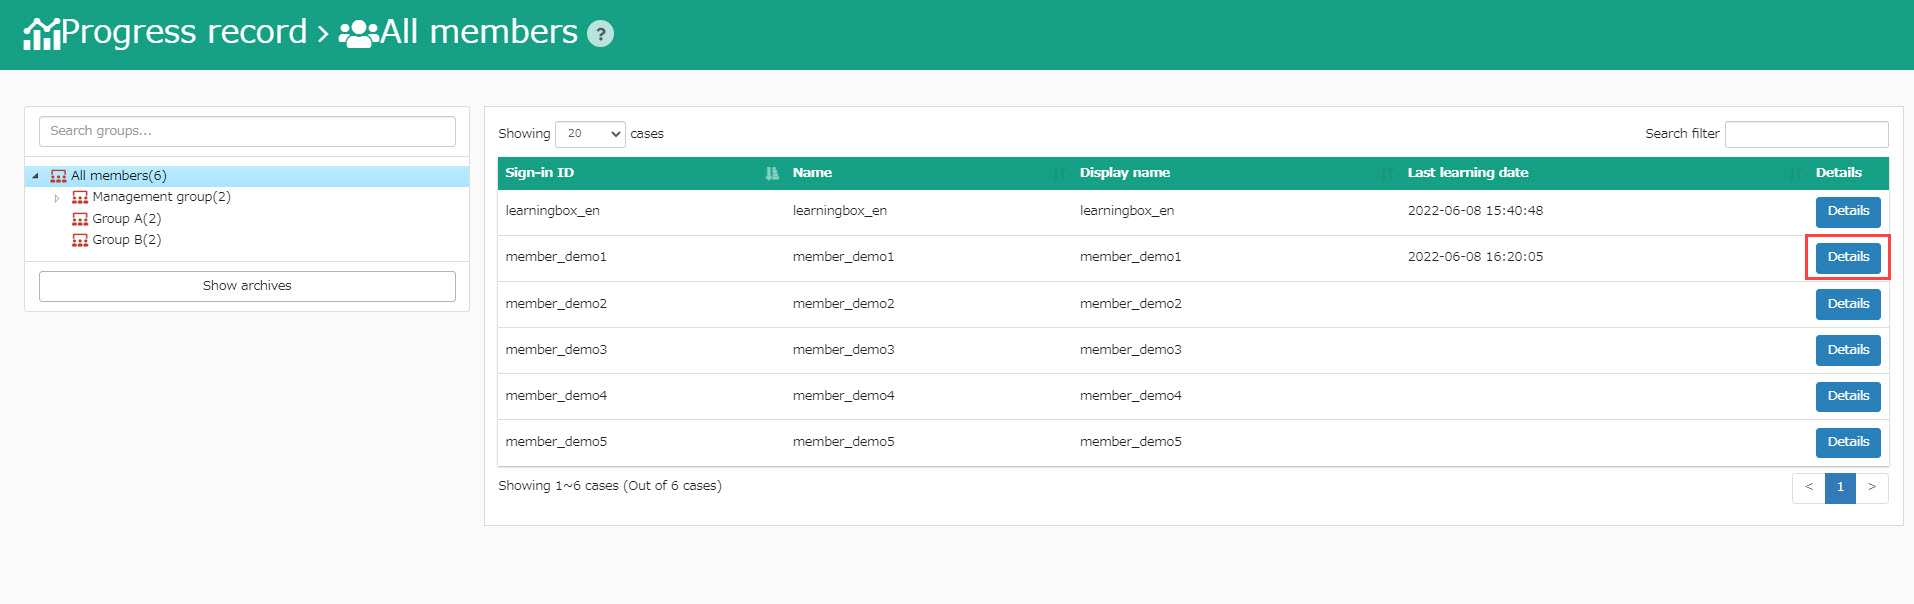
Step 2: Select a member
Members will be listed. Click on "Details" as shown.
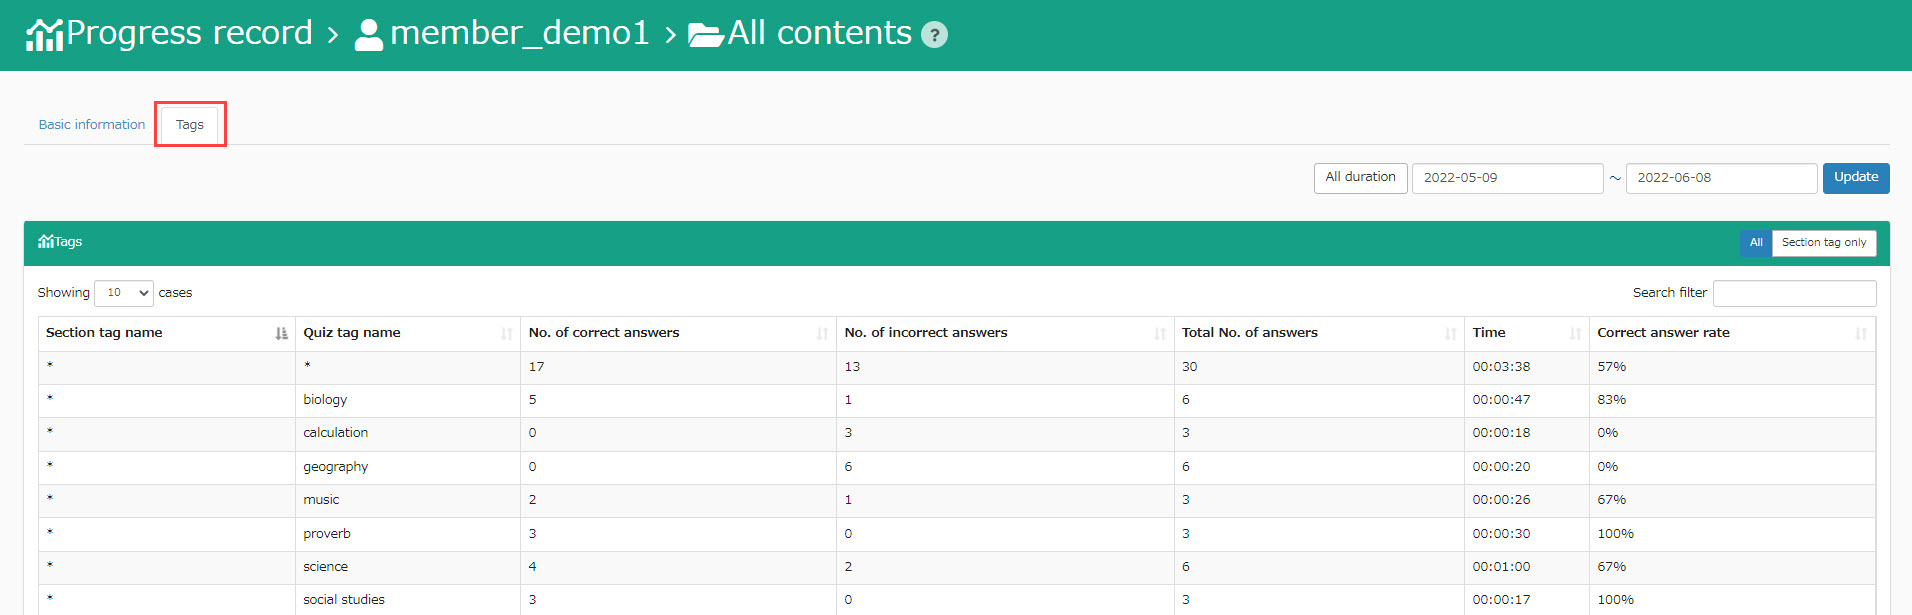
Step 3: Display score data by tag
Click on the "List" tab.
The List shows the data including the number of correct/incorrect answers, total number of answers, time required, and percentage of correct answers for each tag.
You can sort the data by content, time period, and search filters.
※In order to view a specific content, select one in the "Your learning progress" at the bottom of the "Basic information" tab screen.
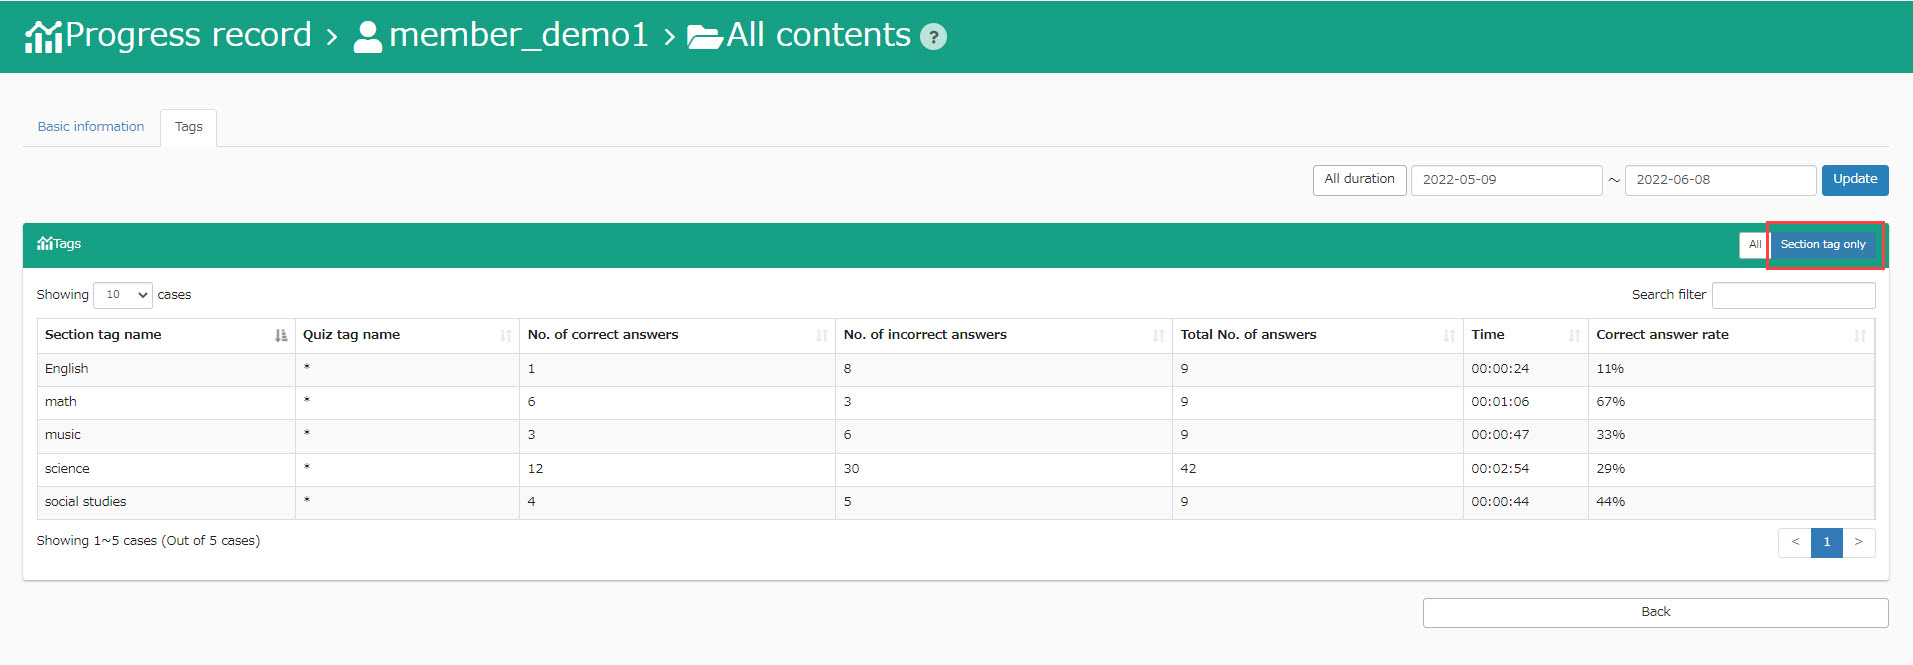
Step 4: Display only section tags
Click on "Section Tag Only" to view only score data with section tags.
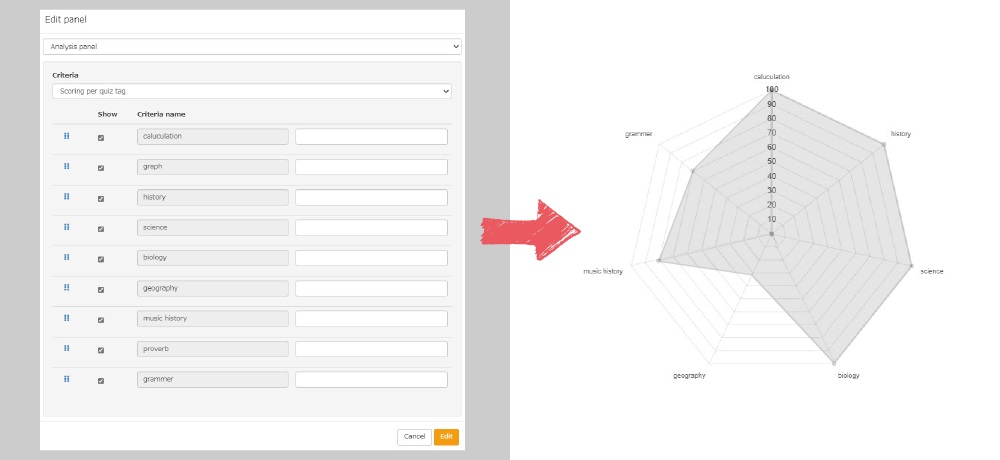
Radar chart analysis for score management

learningBOX graphs scores and score percentages for multiple items, which allows members to grasp their strong and weak points at a glance.
Features of score chart
1. Check the balance of scores/its percentage for each item
2. Grasp the area of weak points
For more information about the usage, click onScore chart.
1. Check the balance of scores/its percentage for each item
2. Grasp the area of weak points
Summary
In this article, we introduced "members' score analysis" utilizing the function of "tags" and "score chart" of learningBOX.
Admins can check at a glance the members' level of understanding, how they overcome their weak points, the scores for each subject and overall trends.
Our e-learning system, learningBOX, is open for anyone for FREE.
If you are interested in implementing an e-learning system, try learningBOX.
⇒Use the learningBOX for free!
![[Visualization of Weaknesses] Graph Learners' "Weaknesses" in E-Learning / Analyze Results to Improve Learning Effectiveness](https://learningbox.online/wp-content/uploads/blog/elearning_assay_report_n_00-120x120.jpg)


- Started offering free business manner teaching materials
- Compliance materials are now available free of charge.
Comment ( 0 )
Trackbacks are closed.


No comments yet.